

How Are Population Pyramids Used to Analyze Population Data?
As we know China's population is declining, America's population is stable and India's population is growing.
Have you ever thought about how we get to know about the population size or its composition? The data are compared of different countries over time using a population pyramid. A population pyramid is a graphical representation that can be used to compare the size of the population and the population's present and future trends.
What is a Population Pyramid?
A population pyramid is the graphical representation of the distribution of the population by sex, and age group. It takes the shape of a pyramid when the population is growing. Population pyramids are also known as age pyramids because it is a graphical representation of age.
Structure of a Population Pyramid
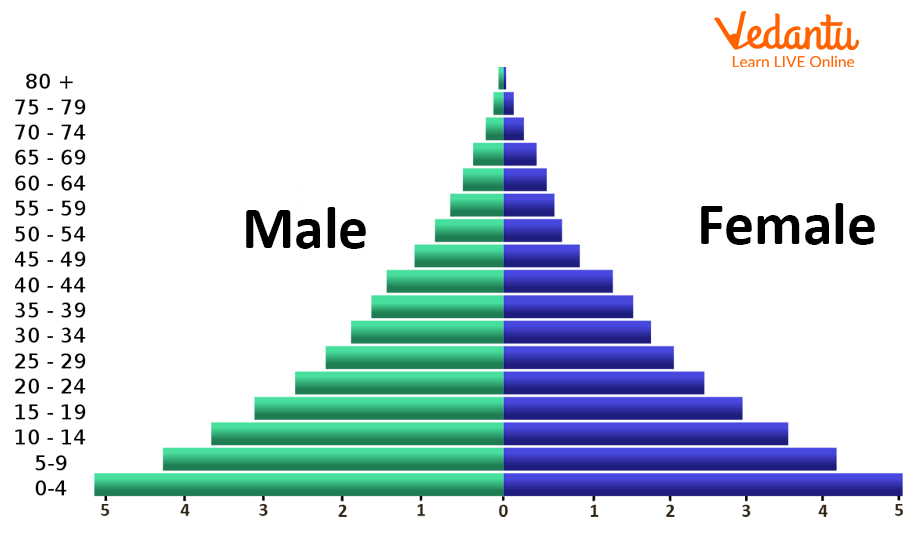
A population pyramid is a graphical representation that demonstrates the distribution of ages across a population.
It is divided from the centre between male and female individuals. The males are shown on the left side and the females are on the right side from the centre of the graph.
The population size is shown on the x-axis and ages are shown on the y-axis.
Structure of Population Pyramid
Types of Population Pyramids
There are mainly three types of the population pyramid or population graphs
Expansive
Stationary
Constrictive
Expansive Pyramid
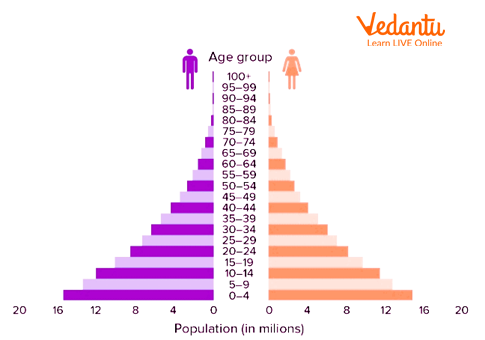
These types of pyramids have a much larger population of pre-reproductive and reproductive age groups and a population of post-reproductive age groups is very less compared to pre-reproductive and reproductive age groups.
These types of pyramids are seen in developing countries. Here in these countries, the fertility rate is usually high but life expectancy is very less. So the base of the pyramid is wide and tapers towards the top with a triangular shape.
Examples of countries having expansive pyramids are India and Nigeria.
The Expansive Population Pyramid
Stationary Population Pyramid
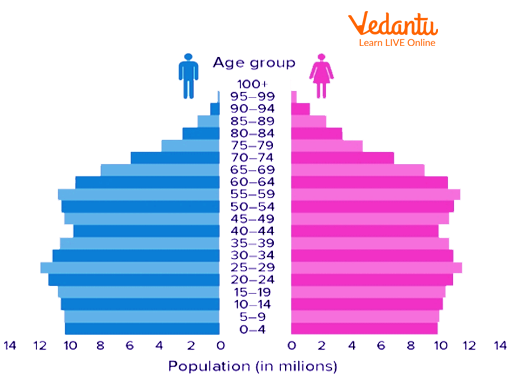
Stationary population pyramids have an equal population in each group. That's why the name stationary means the birth and death rates are equal and the population is neither increasing nor decreasing. There are usually not any major changes in the mortality rate and fertility rates.
The shape of this pyramid is bell-shaped.
These types of pyramids are generally of the developed countries such as America.
The Stable Population Pyramid
Constrictive Population Pyramid
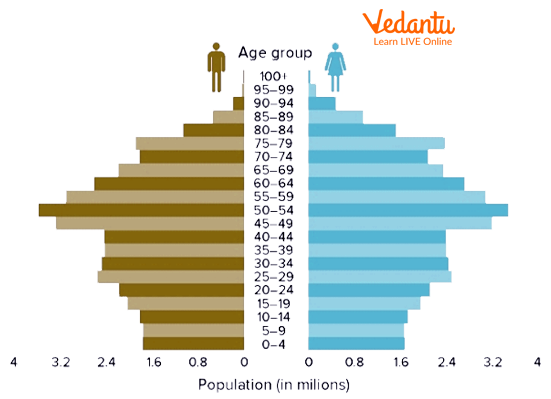
As the name itself suggests that the population is decreasing here, these types of pyramids show declining birth rates, low fertility rates, high life expectancy, and low mortality rates.
These graphs are narrow at the base and show the decreasing size of the population. These graphs are urn-shaped.
Here the post-reproductive and elderly population is more than the pre-reproductive and reproductive population.
This type of graph is seen in Japan.
The Constructive Population Pyramid
Uses of the Population Pyramid
There are various uses of the population pyramid
It tells about the composition of the population of any particular area
It tells about the number of dependent individuals (Children, elderly people) in any area
It also tells us about the difference in sexes of any given area.
It also tells about the mortality rate and fertility rate
Use to find data on the future growth of the population
Interesting Points
Only 10% of the world's population lives in the southern hemispheres
The size of the European population is decreasing and the size of the African population is increasing.
If every female in the world received secondary schooling, the population could be 3 billion short by 2050.
Important Questions
1. What does the expansive pyramid represent?
Growing population
Stable population
Decreasing population
All of the above
Ans: (option 1) growing population. If Population size increases with time, then it is represented by an expansive pyramid.
2. What is the population pyramid?
The pattern of population distribution in urban areas
A graphical representation of the age, and sex composition of a given population in any area
When the population density of an area is so high that people live in tall buildings
None of the above
Ans: (option 2) A graphical representation of the age and sex composition of a population in a given area is called a population pyramid.
3. The age distribution of a population is determined by
Timing of birth
Timing of death
The rate at which the population is growing
All of the above
Ans: (option 3) The rate at which the population is growing is determined by the age distribution of a population.
Practice Questions
What are the things that change the shape of a population pyramid?
What are the three types of population pyramids?
What does the shape of a population pyramid reflect?
Which age pyramid is most stable and why?
How can the population pyramid predict the future?
Conclusion
A population pyramid is a graphical representation of the distribution of people by sex and age group. There are usually three types of age pyramids - The expansive age pyramid, stationary age pyramid, and constructive age pyramid.
And all three pyramids are of different shapes. These pyramids also have various uses such as telling us about the mortality and fertility rates of any given area.


FAQs on Population Pyramid Explained: Structure, Types & Uses
1. What is a population pyramid, and what does it represent?
A population pyramid is a graphical illustration that shows the distribution of various age groups in a population, which forms the shape of a pyramid when the population is growing. It consists of two back-to-back bar graphs, with the population plotted on the X-axis and age on the Y-axis. The left side typically represents males, and the right side represents females.
2. What are the three main types of population pyramids?
The three main types of population pyramids are based on the population's growth status:
- Expansive Pyramid: Features a broad base and a narrow top, indicating a high birth rate and a large young population. This signifies rapid population growth.
- Constrictive Pyramid: Has a base that is narrower than the middle section, showing a low birth rate and an ageing population. This signifies a declining population.
- Stationary Pyramid: Exhibits a rectangular or pillar-like shape, where the population in each age group is relatively stable. This indicates slow or zero population growth.
3. How do birth rates and death rates influence the shape of a population pyramid?
Birth and death rates are the primary factors that determine the shape of a population pyramid. A high birth rate creates a wide base because of the large number of individuals in the youngest, pre-reproductive age group. Conversely, a low birth rate leads to a narrow base. A high death rate causes the pyramid to taper quickly towards the top, while a low death rate allows more individuals to reach older age, making the upper sections of the pyramid wider.
4. What does an expansive population pyramid, like that of India, signify for the country's future?
An expansive population pyramid signifies that India has a large proportion of young people in the pre-reproductive and reproductive age groups. This can lead to a 'demographic dividend,' where a large workforce can boost economic growth. However, it also presents the challenge of providing adequate education, healthcare, and employment opportunities for this large young population.
5. Why is the study of population pyramids important for government planning?
The study of population pyramids is crucial for government planning because it allows policymakers to forecast future demographic trends and allocate resources effectively. For example, a country with an expansive pyramid may need to invest more in schools and infrastructure, while a country with a constrictive pyramid might need to focus on healthcare, pensions, and social security for its ageing population.
6. What is the key difference between a constrictive and a stationary population pyramid?
The key difference lies in their reflection of population growth. A stationary pyramid indicates a stable population where birth rates are roughly equal to death rates, resulting in zero growth. In contrast, a constrictive pyramid is narrower at the base, signifying that the death rate has surpassed the birth rate, which leads to a future decline in the total population.
7. What are some real-world examples of countries for each type of population pyramid?
Different countries provide clear examples of the three main pyramid types:
- Expansive: Countries like Nigeria and Afghanistan have classic expansive pyramids, reflecting high fertility rates and a very young population.
- Stationary: Countries like Sweden and France often show stationary or near-stationary pyramids, indicating stable population growth.
- Constrictive: Japan and Germany are prime examples of countries with constrictive pyramids, characterised by an ageing population and low birth rates.
8. What future challenges might a country with a constrictive population pyramid face?
A country with a constrictive population pyramid faces significant long-term challenges, including a shrinking workforce, which can slow economic productivity. It also leads to an increased dependency ratio, where a smaller working-age population must support a large and growing elderly population, placing immense strain on healthcare systems and pension funds.


