


Get Free PDF of Class 8 Maths Chapter 13 Introduction to Graphs Exercise 13.2 Solutions
Exercise 13.2
1. Draw the graphs for the following tables of values, with suitable scales on the axes:
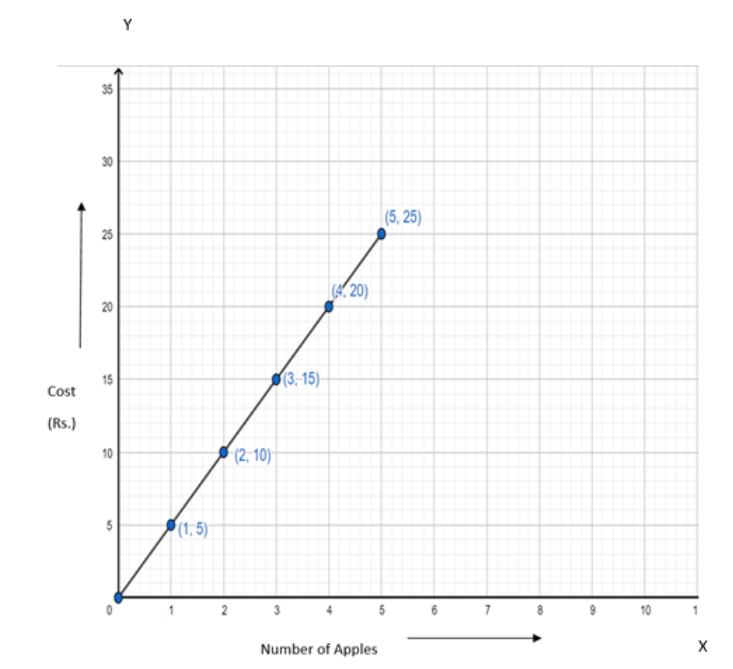
(a) Cost of apples
Ans: Take the number of apples on the x-axis and cost on the y-axis. Take scale for x-axis as \[{\text{1 unit}} = 1{\text{ apple}}\] and for y-axis as \[{\text{1 unit}} = 5{\text{ rupees}}\].
Now plot the points \[{\text{(1,5),(2,10),(3,15),(4,20)}}\]and \[{\text{(5,25)}}\]to get the number of apples-cost linear graph:
(b) Distance travelled by a car
Ans: Take time on x-axis and distance travelled on y-axis. Take scale for x-axis as \[{\text{1 unit}} = 1{\text{ hour}}\]and for y-axis as\[{\text{1 unit}} = 40{\text{ km}}\].
Now plot the points \[{\text{(6,40),(7,80),(8,120)}}\]and \[{\text{(9,160)}}\]to get the time-distance linear graph:
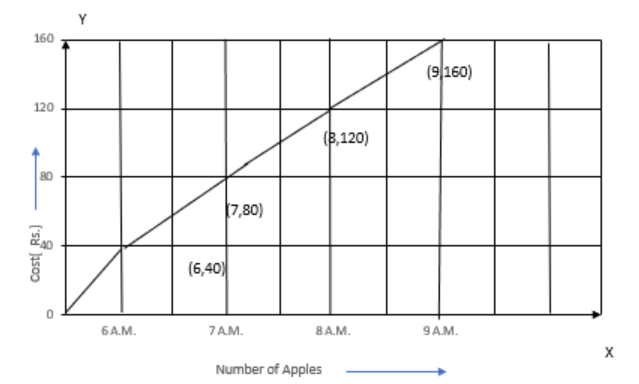
(i) How much distance did the car cover during the period 7.30 a.m. to 8 a.m.?
Ans:
\[ \text{Distance travelled by 7:30 a.m.} = 100 \text{ km} \]
\[{\text{Distance travelled by 8 a}}{\text{.m}}{\text{. }} = 120{\text{ km}}\]
\[{\text{Distance travelled by the car during the period 7:30 a}}{\text{.m}}{\text{. to 8 a}}{\text{.m}}{\text{.}} = {\text{Distance travelled till 8 a}}{\text{.m}}{\text{.}} - {\text{Distance travelled till 7:30 a}}{\text{.m}}{\text{.}}\]
\[{\text{Distance travelled by the car during the period 7:30 a}}{\text{.m}}{\text{. to 8 a}}{\text{.m}}{\text{.}} = 120{\text{ km}} - 100{\text{ km}}\]
\[{\text{Distance travelled by the car during the period 7:30 a}}{\text{.m}}{\text{. to 8 a}}{\text{.m}}{\text{.}} = 20{\text{ km}}\]
Thus, the car covers 20 km during the period 7:30 a.m. to 8 a.m.
(ii) What was the time when the car had covered a distance of 100 km since its start?
Ans: At 7:30 a.m. , the car had covered a distance of 100 km since it’s start.
(c) Interest on deposits for a year:
Ans: Take deposit on x-axis and simple interest on y-axis. Take scale for x-axis as \[{\text{1 unit}} = 1000{\text{ Rs}}\]and for y-axis as\[{\text{1 unit}} = 80{\text{ Rs}}\].
Now plot the points \[{\text{(1000,80),(2000,160),(3000,240),(4000,320)}}\]and \[{\text{(5000,400)}}\]to get the time-distance linear graph:
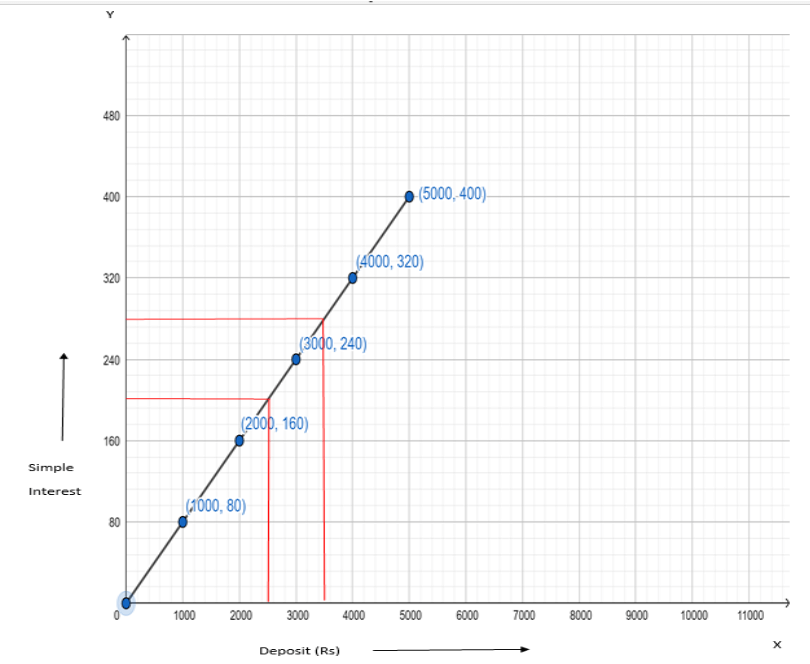
(i) Does the graph pass through the origin?
Ans: From the graph, one can observe that the graph passes through the origin.
(ii) Use the graph to find the interest on Rs 2500 for a year.
Ans: Rs2500 lies in between Rs 2000 and Rs 3000, therefore interest on Rs 2500 lies right in the middle of Rs 160 and Rs 240, i.e., Rs 200.
Thus, interest on Rs 2500 for a year is 200.
(iii) To get an interest of Rs 280 per year, how much money should be deposited?
Ans: Rs 280 lies right in the middle of Rs 240 and Rs 320, therefore deposit with respect to it lies right in the middle of Rs 3000 and Rs 4000, i.e., Rs 3500.
Thus, to get an interest of Rs 280 per year, Rs 3500 must be deposited.
2. Draw a graph for the following:
(i)
Ans: Take sides of a square(in cm) on x-axis and perimeter(in cm) on y-axis. Take scale for x-axis as \[{\text{1 unit}} = 1{\text{ cm}}\]and for y-axis as\[{\text{1 unit}} = 4{\text{ cm}}\].
Now plot the points \[{\text{(2,8),(3,12),(3}}{\text{.5,14),(5,20)}}\]and \[{\text{(6,24)}}\]to get the side-perimeter linear graph of a square:
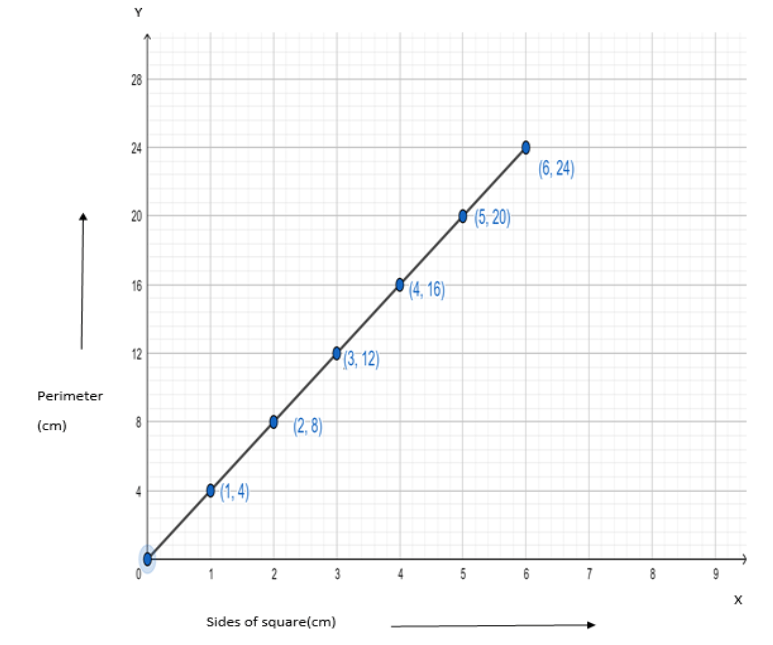
Is it a linear graph?
Ans: The line graph is a straight line, therefore it is a linear graph.
(ii)
Ans: Take sides of a square(in cm) on x-axis and area(in \[c{m^2}\]) on y-axis. Take scale for x-axis as \[1{\text{ unit}} = 1{\text{ cm}}\]and for y-axis as\[1{\text{ unit}} = 4{\text{ c}}{{\text{m}}^2}\].
Now plot the points \[{\text{(2,4),(3,9),(4,16),(5,25)}}\]and \[{\text{(6,36)}}\]to get the side-area linear graph of a square:
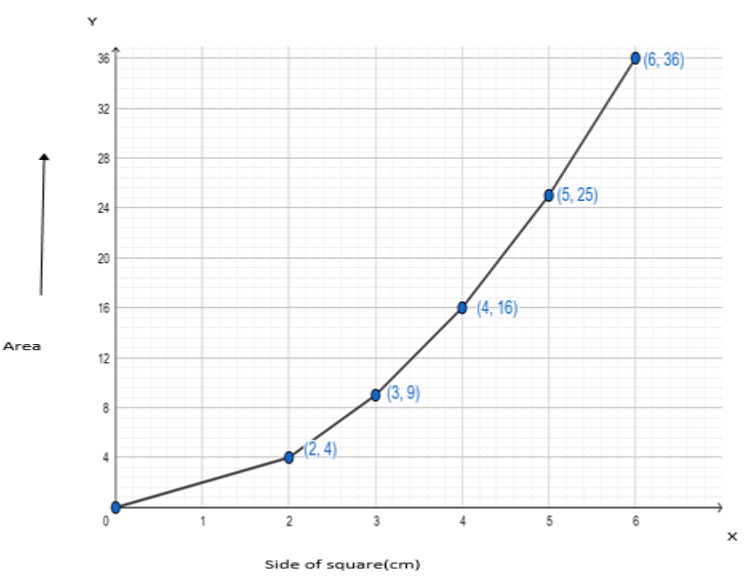
Is it a linear graph?
Ans: The line graph is not a straight line, therefore it is not a linear graph.
NCERT Solutions for Class 8 Maths Chapter 13 Introduction to Graphs Exercise 13.2
Opting for the NCERT solutions for Ex 13.2 Class 8 Maths is considered as the best option for the CBSE students when it comes to exam preparation. This chapter consists of many exercises. Out of which we have provided the Exercise 13.2 Class 8 Maths NCERT solutions on this page in PDF format. You can download this solution as per your convenience or you can study it directly from our website/ app online.
Vedantu in-house subject matter experts have solved the problems/ questions from the exercise with the utmost care and by following all the guidelines by CBSE. Class 8 students who are thorough with all the concepts from the Subject Introduction to Graphs textbook and quite well-versed with all the problems from the exercises given in it, then any student can easily score the highest possible marks in the final exam. With the help of this Class 8 Maths Chapter 13 Exercise 13.2 solutions, students can easily understand the pattern of questions that can be asked in the exam from this chapter and also learn the marks weightage of the chapter. So that they can prepare themselves accordingly for the final exam.
Besides these NCERT solutions for Class 8 Maths Chapter 13 Exercise 13.2, there are plenty of exercises in this chapter which contain innumerable questions as well. All these questions are solved/answered by our in-house subject experts as mentioned earlier. Hence all of these are bound to be of superior quality and anyone can refer to these during the time of exam preparation. In order to score the best possible marks in the class, it is really important to understand all the concepts of the textbooks and solve the problems from the exercises given next to it.
Do not delay any more. Download the NCERT solutions for Class 8 Maths Chapter 13 Exercise 13.2 from the Vedantu website now for better exam preparation. If you have the Vedantu app in your phone, you can download the same through the app as well. The best part of these solutions is these can be accessed both online and offline as well.
Class 8 Maths Chapter 13: Exercises Breakdown
Other Study Material for CBSE Class 8 Maths Chapter 13
Chapter-wise NCERT Solutions for Class 8 Maths
Additional Study Materials for CBSE Class 8 Maths
